Reservoir Characterization Indices (RCI)
Geochemistry-derived key reservoir properties (matrix permeability, oil-in-place, etc) for reservoir characterization, landing optimization and reserves calculation
Data mining the unique patterns in geochemical fingerprint data from the cuttings or core samples, RevoChem has developed a group of Reservoir Characterization Indices (RCI), including reservoir quality index (RQI) as a matrix permeability indicator, and oil-in-place index (OIPI). The RCI analysis provides an independent dataset derived solely from oil extracted from cuttings or core samples, while petrophysical analysis analyzes the rock itself. Due to the Physical Extraction method, where only the mobile oil portion is extracted, the OIPI better represents the producible oil in contrast to the Dean Stark extraction method which removes both mobile and immobile oil portions.
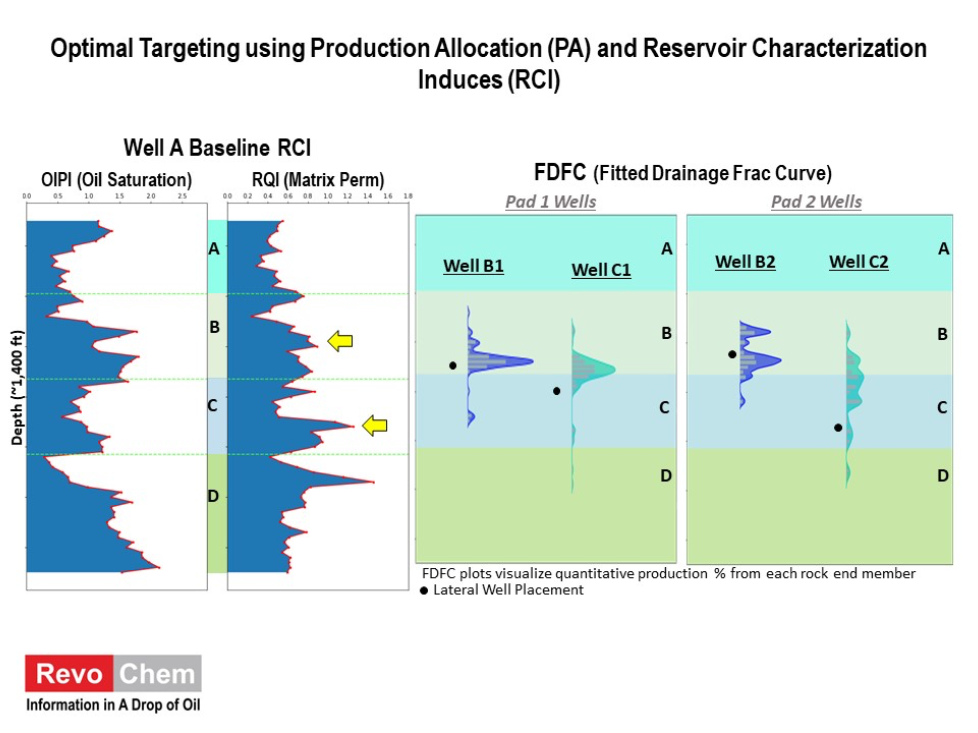
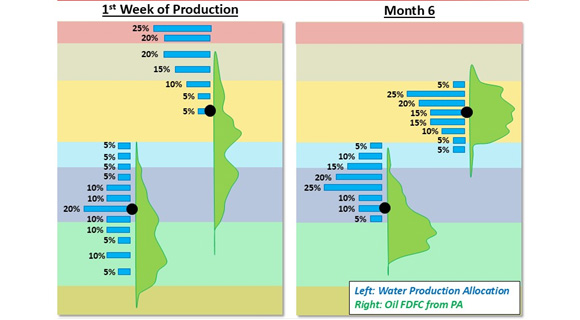
Production Allocation (PA) & Drainage Frac Height
Geochemistry-derived key reservoir properties (matrix permeability, oil-in-place, etc) for reservoir characterization, landing optimization and reserves calculation
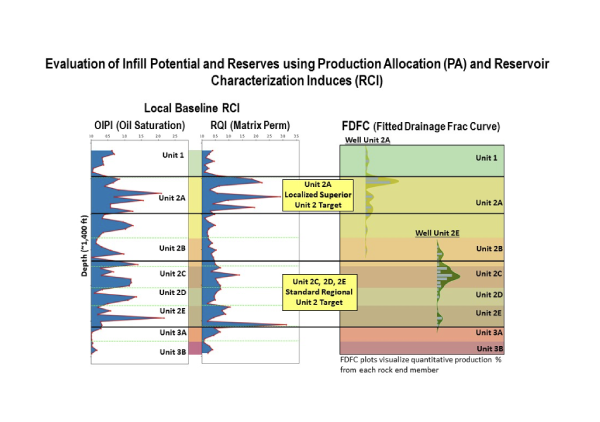
When the vertical baseline is profiled through cuttings or core to provide geochemical characteristics of each formation, the drainage frac height can be quantified accurately using the Production Allocation (PA) technique down to ~10-15' accuracy vertically. The produced oil samples are collected and back-allocated to their contributing formations represented by the baseline profile based on the high-resolution GCXGC geochemical fingerprint data.
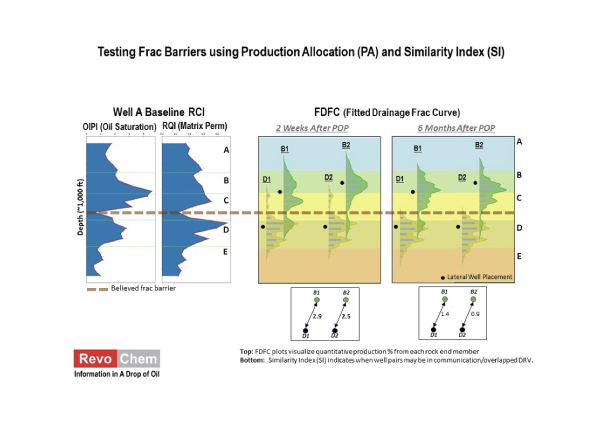
Similarity Index (SI) for Well Communication
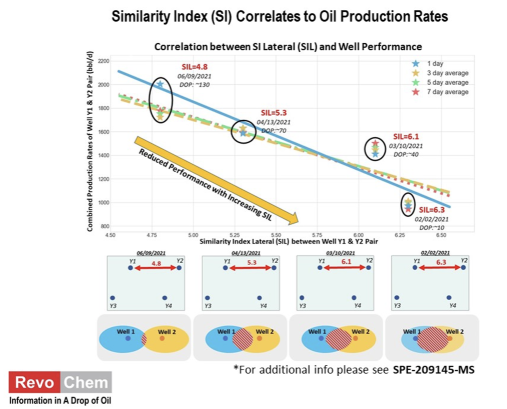
Semi-quantitative characterization of well communication and DRV for spacing and completion optimization
In lieu of lateral cuttings, RevoChem has developed a semi-quantitatively tool to evaluate DRV and well communication. We know that the geochemical fingerprints of each oil sample are determined by the drainage rock volume (DRV) of its producer, therefore, the more similar two oils are, the more similar the DRV of its producer. SI is calculated by recognizing the similarity of two oil samples. The higher the SI of the two oil samples, the more similar the DRV of the two producers. SI can also be used to indicate potential well communication because two inter-communicated wells should also show higher than normal similarity in their produced oils.
Advanced Water Analysis and Produced Water Allocation
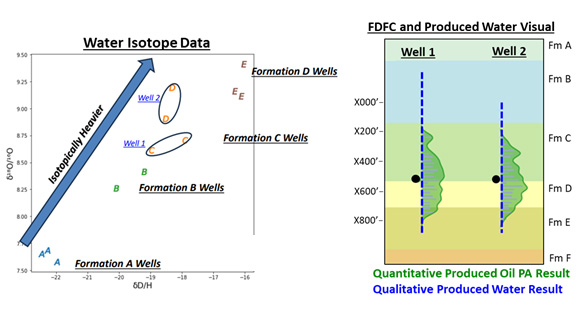
RevoChem's Advanced Water Analysis is divided into two phases. Phase I includes isotopic and elemental analysis (56 elements including cations & anions) of produced water samples useful in monitoring fracwater cleanup and comparison of produced water sources. Phase II includes quantitative allocation of produced water and creation of a baseline using a proprietary porewater reconstruction process.
Additional Analysis

Chemical fingerprinting using volatile organic compounds (VOCs) in medical, food science, and environmental applications
Analysis of VOCs (volatile organic compounds) have applications in medical, food, and environmental fields as well. The VOCs in breath are metabolites released from blood. Breath VOCs reflect physiological status and are correlated with various diseases and their stages. VOCs in coffee and wine, for example, contribute to the aroma and can be analyzed to identify and determine the origin of both desired and undesired aromas, verification and authentication. Finally, the origin of an oil sample can be traced based on its geochemical fingerprint data. If operator can register oils from certain producers as net-zero oils, we can certify the source of an oil sample whether it is coming from any registered net-zero wells.
FAQ
What kind of sample do you need?
For Subsurface Reservoir Characterization
Core or cuttings (both water-based and oil-based mud are ok)
Prefer to have samples that are reasonably fresh, less than a year from the initial drilling date, however older samples will undergo a feasibility test prior to full analysis
For Reservoir Monitoring
Produced oil samples collected at the separator
Please contact RevoChem for sampling protocol or recommended third party for sampling if needed
What is the sampling frequency?
For Core or Cutting Samples
Every 10 to 20 feet intervals adjacent to the completion depths would be appropriate
For Produced Oil Samples
More frequency in collection within the early life of the well, approximately weekly or bi-weekly followed by bi-weekly to monthly samples
Have your results been compared to any other monitoring methods or tools?
Yes our results have been compared and verified using various tools. Our results have been able to provide exceptionally unique and direct information that have been previously unattainable by other indirect methodologies.
- For static reservoir characterization, results have been verified against conventional core analysis, NMR, logging and other petrophysical data
- For reservoir monitoring, results have been compared against pressure gauges, microseismic, tracers and fiber optics
What is the turnaround time?
The turn around time is typically 4 weeks after the sample has been received, however, rush sample options are available for immediate decision making cases.
What asset areas have this technology been applied within?
- Anadarko Basin (United States)
- Bakken (United States)
- Eagle Ford (Unites States)
- Gulf of Mexico (United States)
- Niobrara (United States)
- Permian Basin (United States)
- Montney (Canada)
- Vaca Muerta (Argentina)
- Duvernay
- Alaska
- E. Tex.
- Utica
- PRB
- DJ
- Middle East